Treatment Outcome Visualization
Remission from Depression Questionnaire (RDQ)
The following code visualizes the outcomes from the RDQ. The RDQ is broken up into the following categories:
- Coping Skills: (higher score = more coping skills)
- Positive Mental Health: (higher score = more positive mental health)
- Functioning: (higher score = better functioning)
- Well Being: (higher score = better overall well being)
- Symptoms: (higher score = more severe depression symptoms)
#Read in a New Data Set
Mothership_RDQ<- read_sav("~/Desktop/Coding/data/Mothership_DV.sav")
Mothership_RDQ<-select(Mothership,ID1:Sexuality_1,MDD_C:Day40_CUXOS)
Mothership_RDQ<-data.frame(sapply(Mothership_RDQ,FUN=as.numeric))

#Make This Data Set Long Data
library(tidyr)
Mothership_Long_RDQ <- gather(Mothership_RDQ,rm,RDQ,rdqPRE_coping:rdqPOST_sym,
                              factor_key = "T")
Mothership_Long_RDQ <- Mothership_Long_RDQ[order(Mothership_Long_RDQ$ID1),]

#Create a Time Variable
Mothership_Long_RDQ$PrePost <- NA
Mothership_Long_RDQ$PrePost[Mothership_Long_RDQ$rm=="rdqPRE_coping"]<-"Pre"
Mothership_Long_RDQ$PrePost[Mothership_Long_RDQ$rm=="rdqPRE_pmh"]<-"Pre"
Mothership_Long_RDQ$PrePost[Mothership_Long_RDQ$rm=="rdqPRE_func"]<-"Pre"
Mothership_Long_RDQ$PrePost[Mothership_Long_RDQ$rm=="rdqPRE_wbs"]<-"Pre"
Mothership_Long_RDQ$PrePost[Mothership_Long_RDQ$rm=="rdqPRE_sym"]<-"Pre"
Mothership_Long_RDQ$PrePost[Mothership_Long_RDQ$rm=="rdqPOST_coping"]<-"Post"
Mothership_Long_RDQ$PrePost[Mothership_Long_RDQ$rm=="rdqPOST_pmh"]<-"Post"
Mothership_Long_RDQ$PrePost[Mothership_Long_RDQ$rm=="rdqPOST_func"]<-"Post"
Mothership_Long_RDQ$PrePost[Mothership_Long_RDQ$rm=="rdqPOST_wbs"]<-"Post"
Mothership_Long_RDQ$PrePost[Mothership_Long_RDQ$rm=="rdqPOST_sym"]<-"Post"


#Create a New Data Set with an Average Depression Variable and Race
Mothership_Mean_RDQ<-Mothership_Long_RDQ %>%
  group_by(rm,PrePost) %>%
  summarise(RDQ=mean(RDQ,na.rm=TRUE))

#Add a Paired Variable to the New Data Set
Mothership_Mean_RDQ<-mutate(Mothership_Mean_RDQ,
                            paired=case_when(rm=="rdqPRE_coping"~"1",
                                             rm=="rdqPOST_coping"~"1",
                                             rm=="rdqPRE_pmh"~"2",
                                             rm=="rdqPOST_pmh"~"2",
                                             rm=="rdqPRE_func"~"3",
                                             rm=="rdqPOST_func"~"3",
                                             rm=="rdqPRE_wbs"~"4",
                                             rm=="rdqPOST_wbs"~"4",
                                             rm=="rdqPRE_sym"~"5",
                                             rm=="rdqPOST_sym"~"5"))

Mothership_Mean_RDQ
## # A tibble: 10 × 4
## # Groups: rm [10]
## rm PrePost RDQ paired
## <fct> <chr> <dbl> <chr>
## 1 rdqPRE_coping Pre 3.16 1
## 2 rdqPRE_pmh Pre 6.42 2
## 3 rdqPRE_func Pre 7.85 3
## 4 rdqPRE_wbs Pre 3.59 4
## 5 rdqPRE_sym Pre 31.9 5
## 6 rdqPOST_coping Post 5.96 1
## 7 rdqPOST_pmh Post 13.2 2
## 8 rdqPOST_func Post 12.2 3
## 9 rdqPOST_wbs Post 8.59 4
## 10 rdqPOST_sym Post 17.0 5#Pre Post RDQ Plot
ggplot(data=Mothership_Mean_RDQ,
aes(x=factor(PrePost,level=c("Pre","Post")),y=RDQ,
group=rm,color=paired,!is.na(PrePost)))+
geom_point(size=2.5)+
geom_line(group=Mothership_Mean_RDQ$paired,size=1.5)+
scale_x_discrete(name="Time Point")+
scale_y_continuous(name="RDQ Subscore")+
ggtitle("Mean Pre and Post Scores of the Remission from Depression Questionnaire")+
theme(panel.grid.major.y = element_line(color = "grey",size = 0.5,linetype = 2))+
theme(panel.background=NULL)+
theme(legend.title = element_blank())+
scale_color_manual(values=c("1"="#8956BB","2"="#4C4452","3"="#B1A8B9",
"4"="#00BCA3","5"="#008570"),
labels=c("Coping Skills","Positive Mental Health",
"Functioning","Well-Being","Symptoms"))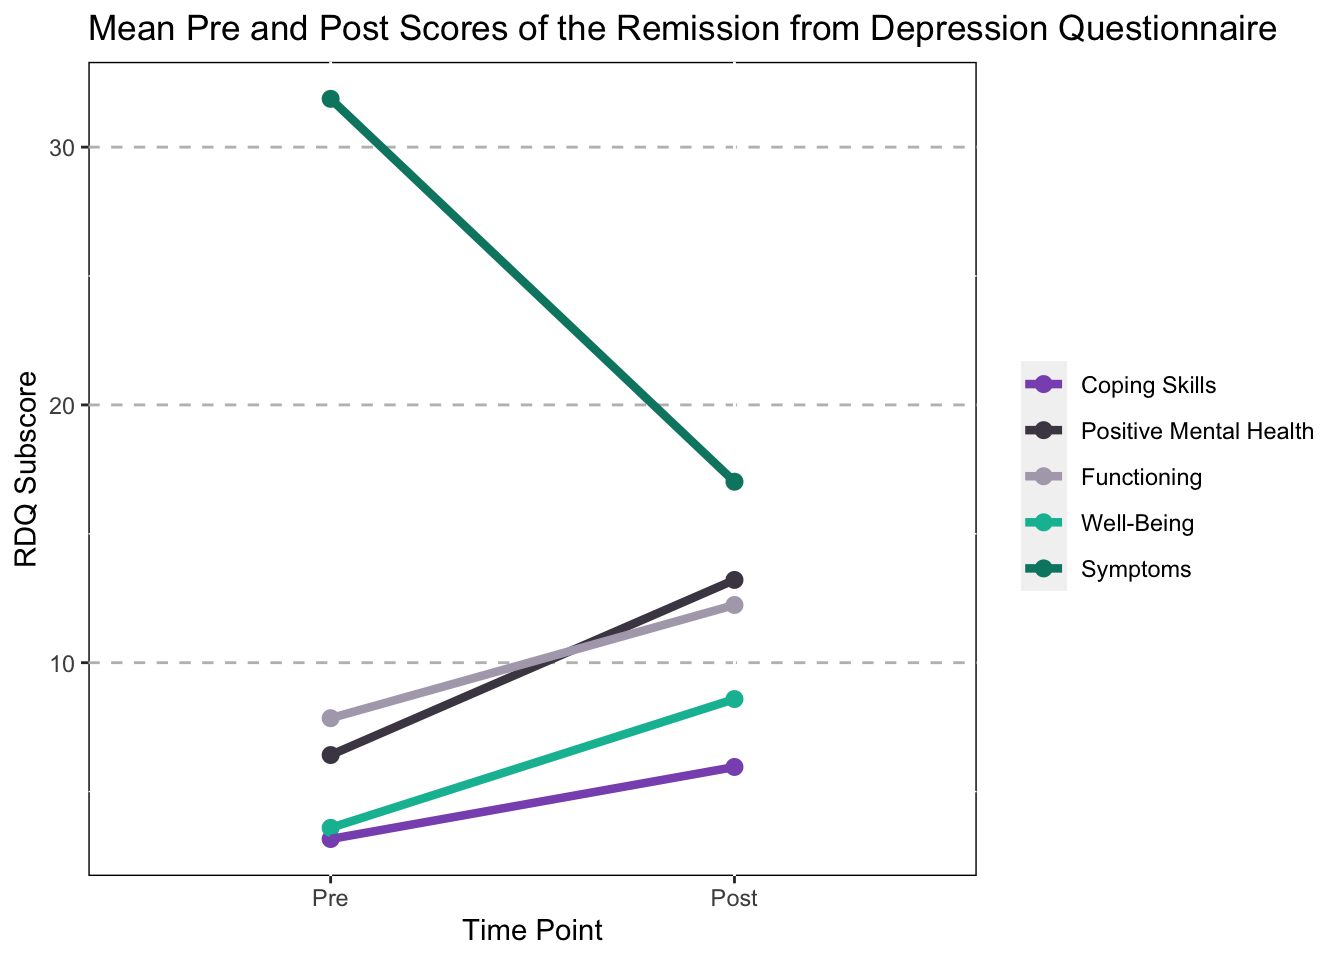
Pre and Post Scores
Extract pre/post scores
# 1. First adjust the their values for length of stay above 40 to 40, because the measures don't go above 40 days.

Mothership_post <- Mothership %>%
  mutate(Days_complete_W = ifelse(Days_complete_1 > 40, 40, Days_complete_1),

#2. Create pre_scores
      CUXOS_pre = Day1_CUXOS,
      CUDOS_pre = Day1_CUDOS
      ) %>%
  filter(!is.na(Days_complete_W)) %>%
  filter(!Days_complete_W == 0)

sum(is.na(Mothership_post$Days_complete_W))
## [1] 0#3. Then create df with CUDOS and CUXOS scores
# Depression
CUDOS_Score <- select(Mothership_post,
Day1_CUDOS:Day40_CUDOS)
CUDOS_Score <- data.frame(CUDOS_Score)
# Anxiety
CUXOS_Score <- select(Mothership_post, Day1_CUXOS:Day40_CUXOS)
CUXOS_Score <- data.frame(CUXOS_Score)
length(Mothership_post$Days_complete_W)## [1] 8367#4. Extract the valeues for each patient at their last day (length of stay), and create a CUDOS and CUXOS post score.
# Mothership_post2 <- Mothership_post %>%
# mutate(
# CUDOS_post = CUDOS_Score[cbind(seq_along(1:8610),CUDOS_Score$Days_complete_W)],
# CUXOS_post = CUXOS_Score[cbind(seq_along(1:8610),CUXOS_Score$Days_complete_W)]
# )
# CUDOS_Score2=CUDOS_Score[,2:41]
# CUXOS_Score2=CUXOS_Score[,2:41]
Mothership_post <- Mothership_post %>%
mutate(
CUDOS_post = CUDOS_Score[cbind(c(1:8367),Mothership_post$Days_complete_W)],
CUXOS_post = CUXOS_Score[cbind(c(1:8367),Mothership_post$Days_complete_W)]
)
####WTF#5. create new DF with Varaibles we want
AnxDep_PrePost <- data.frame(cbind(Mothership_post$ID1,
Mothership_post$Disorder_Type,
Mothership_post$CUDOS_pre,
Mothership_post$CUDOS_post,
Mothership_post$CUXOS_pre,
Mothership_post$CUXOS_post)) %>%
filter(!is.na(Mothership_post$Disorder_Type))
colnames(AnxDep_PrePost) = c("ID1","Disorder_Type", "CUDOS_pre","CUDOS_post","CUXOS_pre","CUXOS_post")
#6. Create long data frame
AnxDep_PrePost_Long <- AnxDep_PrePost %>%
pivot_longer(
cols = CUDOS_pre:CUXOS_post,
names_to = "Test",
values_to = "Score"
)
AnxDep_PrePost_Long <-AnxDep_PrePost_Long %>%
mutate(
PrePost = ifelse(
Test == "CUDOS_pre", "Pre",
ifelse(Test == "CUXOS_pre" , "Pre", "Post"
)),
Score = as.integer(Score),
Test = as.factor(Test),
Test = as.factor(ifelse(Test == "CUDOS_pre", "CUDOS",
ifelse(Test == "CUDOS_post", "CUDOS", "CUXOS"
))))
#7. Convert to data frame with means of values to be plotted
AnxDep_PrePost_mean<-AnxDep_PrePost_Long %>%
group_by(Test,PrePost) %>%
summarise(Score=mean(Score,na.rm=TRUE))Overall Plot
# Pre Post CUDOS/CUXOS Plot
ggplot(data=AnxDep_PrePost_mean,
       aes(x=factor(PrePost,level=c("Pre","Post")),y=Score,
           group=Test,color=Test))+
  geom_point(size=2.5)+
  geom_line(group=AnxDep_PrePost_mean$PrePost,size=1.5)+
  scale_x_discrete(name="Time Point")+
  scale_y_continuous(name="CUDOS/CUXOS Score")+
  ggtitle("Mean Pre and Post Scores of the Anxiety and Depression")+
  theme(panel.grid.major.y = element_line(color = "grey",size = 0.5,linetype = 2))+
  theme(panel.background=NULL)+
  theme(legend.title = element_blank())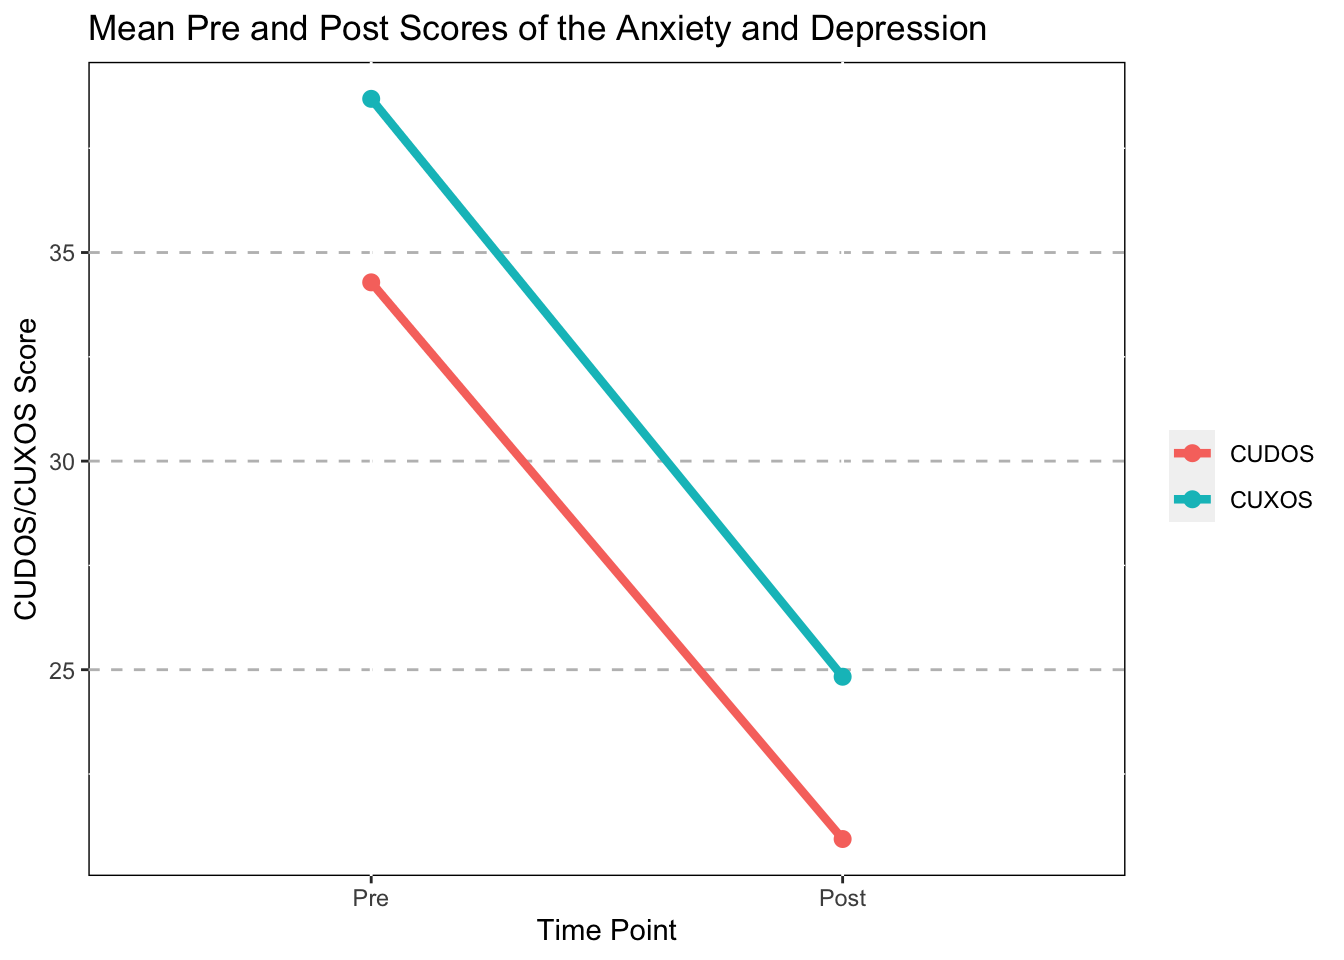
Line Plot By Disorder
#1. Creaate new datasets with only anxiety / depresssion

ANX_PrePost<- AnxDep_PrePost_Long %>%
  filter(Test == "CUXOS")

DEP_PrePost<- AnxDep_PrePost_Long %>%
  filter(Test == "CUDOS")


#2. Create DF grouped buy disorder type
ANX_PrePost_mean<-ANX_PrePost %>%
  group_by(Disorder_Type,PrePost) %>%
  summarise(Score=mean(Score,na.rm=TRUE))

DEP_PrePost_mean<-DEP_PrePost %>%
  group_by(Disorder_Type,PrePost) %>%
  summarise(Score=mean(Score,na.rm=TRUE))

#3. Plot em

#### ANX
ggplot(data=ANX_PrePost_mean,
       aes(x=factor(PrePost,level=c("Pre","Post")),y=Score,
           group=Disorder_Type,color=Disorder_Type))+
  geom_point(size=2.5)+
  geom_line(size=1)+
  scale_x_discrete(name="Time Point")+
  scale_y_continuous(name="CUXOS Score")+
  labs(title = "Mean Pre and Post Anxiety Scores By Disorder Type",
       subtitle = "Self Report anxiety was assessed using the CUXOS",
       caption = "Symptom severity: 0-10 (remission), 11-20 (minimal), 21-30 (mild), 31-40 (moderate), 41+ (severe)")+
  theme(panel.grid.major.y = element_line(color = "grey",size = 0.5,linetype = 2))+
  theme(panel.background=NULL)+
theme(legend.title = element_blank()) 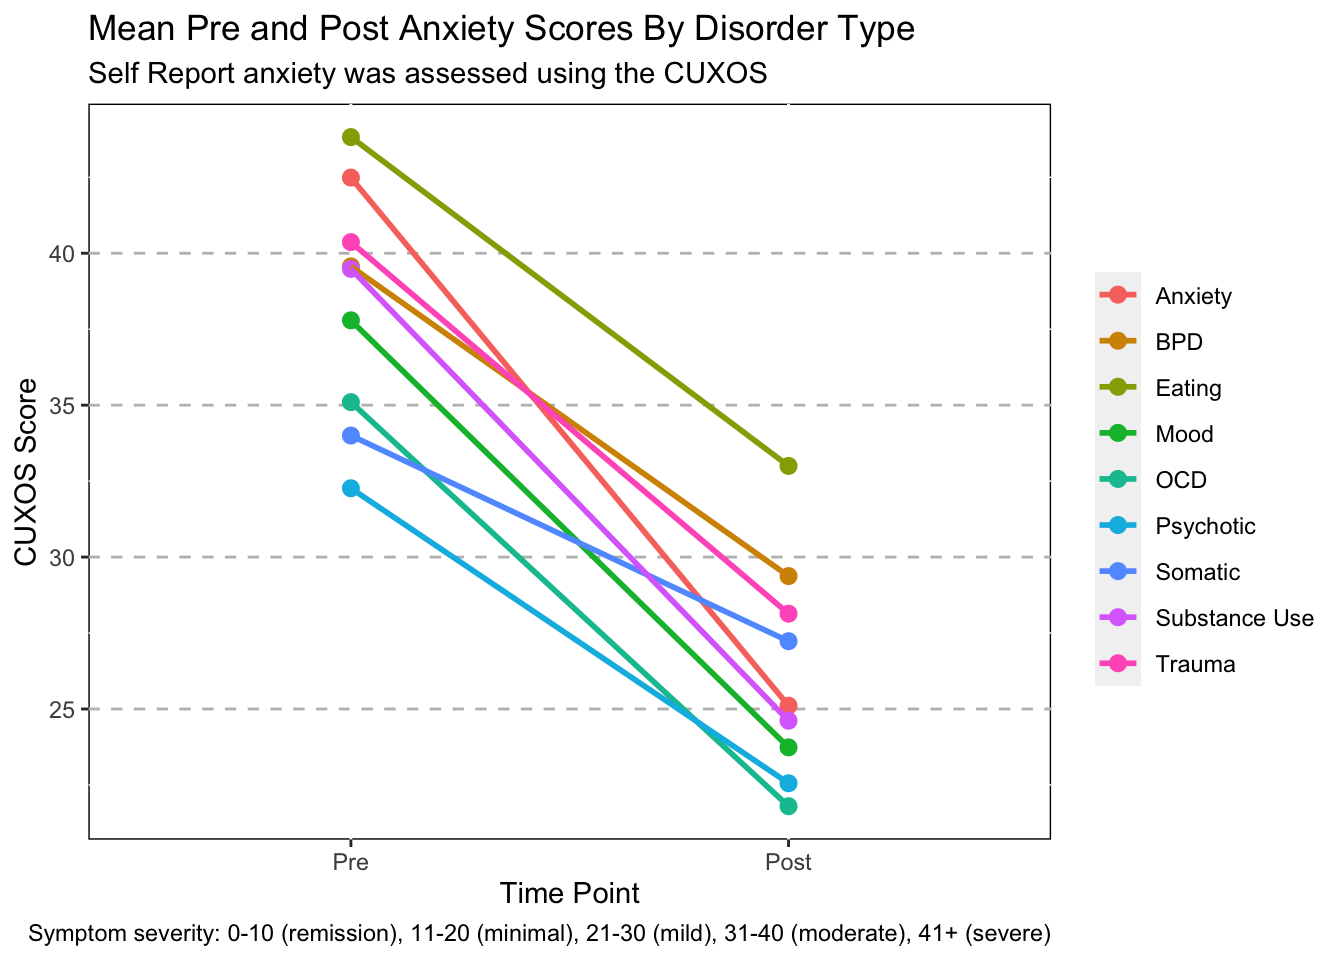
#### DEP
ggplot(data=DEP_PrePost_mean,
       aes(x=factor(PrePost,level=c("Pre","Post")),y=Score,
           group=Disorder_Type,color=Disorder_Type))+
  geom_point(size=2.5)+
  geom_line(size=1)+
  scale_x_discrete(name="Time Point")+
  scale_y_continuous(name="CUDOS Score")+
  labs(title = "Mean Pre and Post Depression Scores By Disorder Type",
       subtitle = "Self report depression was assessed using the CUDOS",
       caption = "Symptom severity: 0-10 (remission), 11-20 (minimal), 21-30 (mild), 31-45 (moderate), 46+ (severe)")+
  theme(panel.grid.major.y = element_line(color = "grey",size = 0.5,linetype = 2))+
  theme(panel.background=NULL)+
  theme(legend.title = element_blank())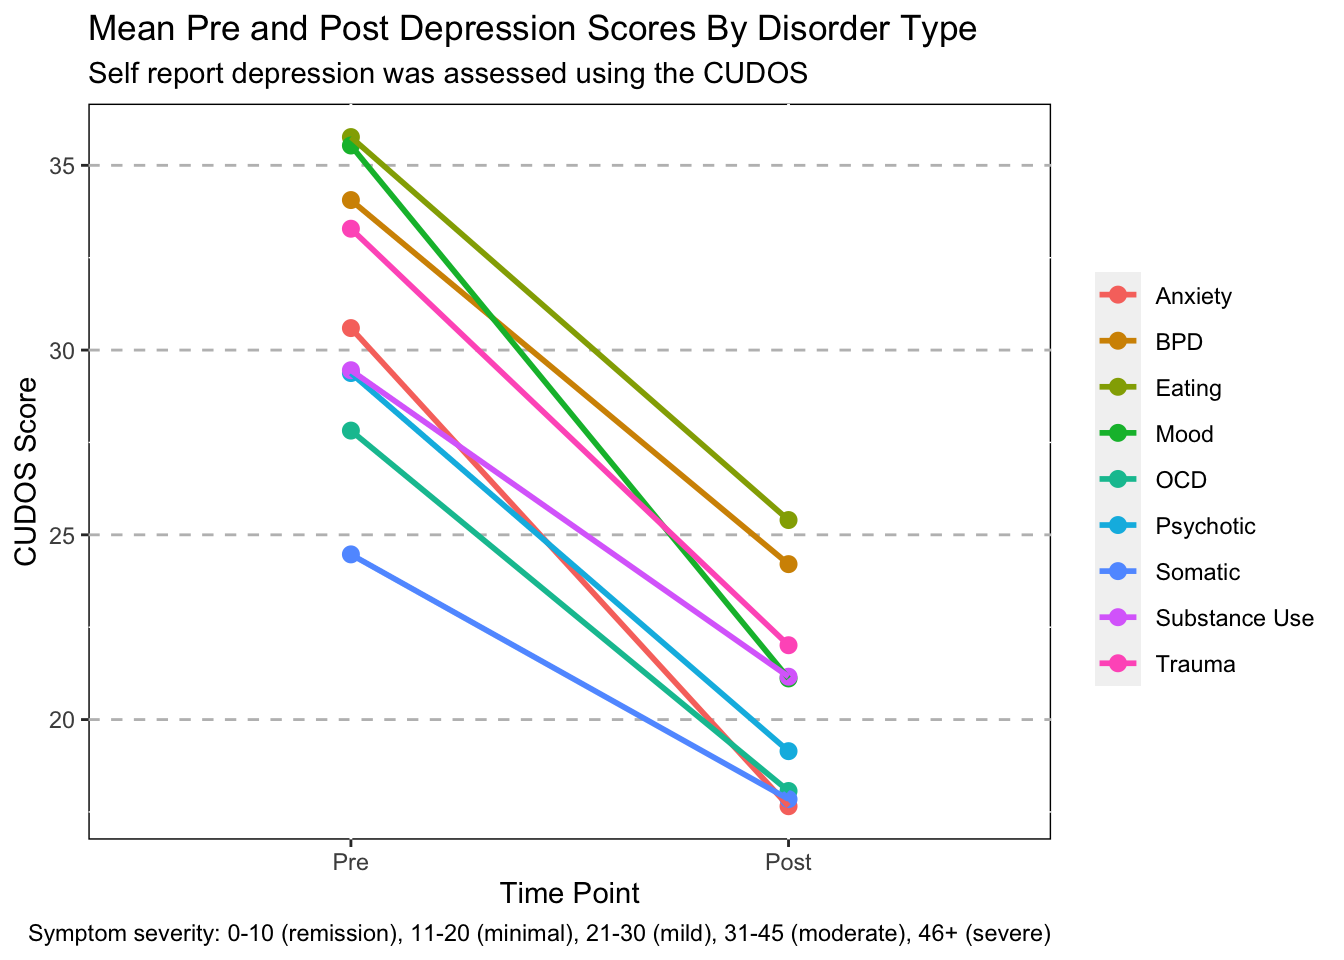
Dumbell Plot by Disorder
Pre_ANX<-ANX_PrePost_mean %>%
  filter(PrePost == "Pre")

Post_ANX<-ANX_PrePost_mean %>%
  filter(PrePost == "Post")

Plot_Text<- dplyr::count(ANX_PrePost, Disorder_Type)
Plot_Text
## # A tibble: 9 × 2
## Disorder_Type n
## <chr> <int>
## 1 Anxiety 1478
## 2 BPD 538
## 3 Eating 40
## 4 Mood 7870
## 5 OCD 130
## 6 Psychotic 272
## 7 Somatic 52
## 8 Substance Use 92
## 9 Trauma 1988ggplot(data=Pre_ANX,
aes(x=Disorder_Type,y=Score,
group=Disorder_Type,color=Disorder_Type))+
geom_segment(aes(x=Disorder_Type, xend=Post_ANX$Disorder_Type, y=Score, yend=Post_ANX$Score),color = "#aeb6bf",
size = 4, #Note that I sized the segment to fit the points
alpha = .5) +
geom_point( aes(x=Disorder_Type, y=Score), color= "#F90000", size=3.5) +
geom_point( aes(x=Post_ANX$Disorder_Type, y=Post_ANX$Score), color= "#0CC541", size=3.5) +
labs(title = "Mean Pre and Post Anxiety Scores By Disorder Type",
subtitle = "Self Report anxiety was assessed using the CUXOS",
caption = "Symptom severity: 0-10 (remission), 11-20 (minimal), 21-30 (mild), 31-40 (moderate), 41+ (severe)")+
scale_y_reverse()+
# limits = c(10, 50))+
coord_flip() +
theme_classic()+
theme(#legend.position = "none",
plot.background = element_rect(
fill = "white",
colour = "white"))
#sum(as.factor(ANX_PrePost$Disorder_Type))
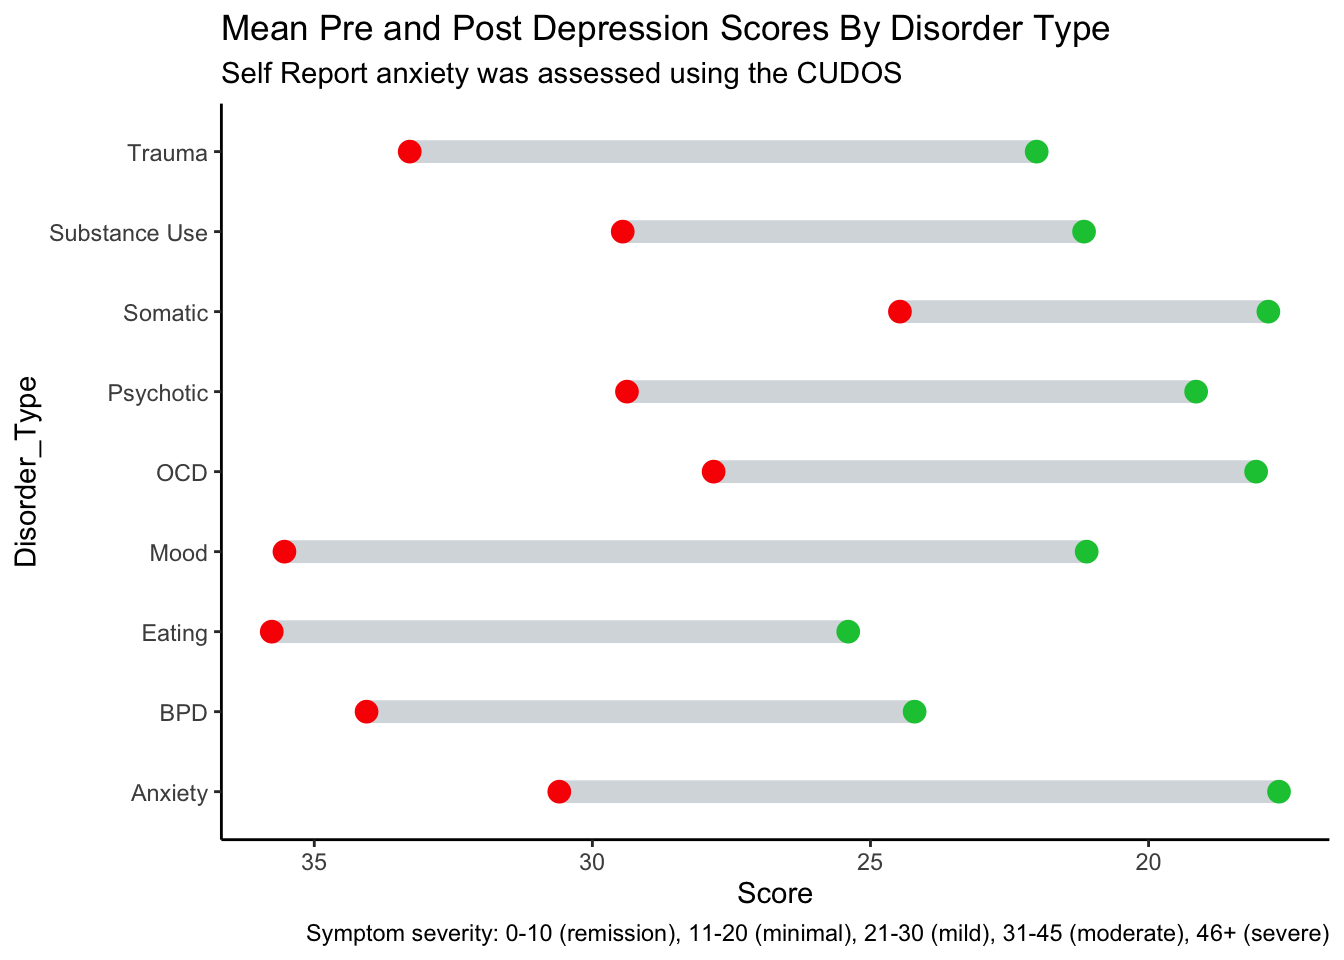
Pre_DEP<-DEP_PrePost_mean %>%
filter(PrePost == "Pre")
Post_DEP<-DEP_PrePost_mean %>%
filter(PrePost == "Post")
ggplot(data=Pre_DEP,
aes(x=Disorder_Type,y=Score,
group=Disorder_Type,color=Disorder_Type))+
geom_segment(aes(x=Disorder_Type, xend=Post_DEP$Disorder_Type, y=Score, yend=Post_DEP$Score),color = "#aeb6bf",
size = 4, #Note that I sized the segment to fit the points
alpha = .5) +
geom_point( aes(x=Disorder_Type, y=Score), color= "#F90000", size=3.5) +
geom_point( aes(x=Post_DEP$Disorder_Type, y=Post_DEP$Score), color= "#0CC541", size=3.5) +
labs(title = "Mean Pre and Post Depression Scores By Disorder Type",
subtitle = "Self Report anxiety was assessed using the CUDOS",
caption = "Symptom severity: 0-10 (remission), 11-20 (minimal), 21-30 (mild), 31-45 (moderate), 46+ (severe)",
ylab = "Disorder Type")+
scale_y_reverse()+
# limits = c(10, 50))+
coord_flip() +
theme_classic()+
theme(#legend.position = "none",
plot.background = element_rect(
fill = "white",
colour = "white"))